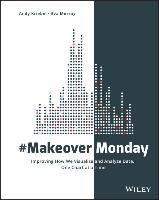
#MakeoverMonday
Informacje szczegółowe
Pokaż wszystkieKażdy sprzedawca w empik.com jest przedsiębiorcą. Wszystkie obowiązki związane z umową sprzedaży ciążą na sprzedawcy. Za wysłanie produktu odpowiada sprzedawca.
Opis produktu
Explore different perspectives and approaches to create more effective visualizations #MakeoverMonday offers inspiration and a giant dose of perspective for those who communicate data. Originally a small project in the data visualization community, #MakeoverMonday features a weekly chart or graph and a dataset that community members reimagine in order to make it more effective. The results have been astounding; hundreds of people have contributed thousands of makeovers, perfectly illustrating the highly variable nature of data visualization. Different takes on the same data showed a wide variation of theme, focus, content, and design, with side-by-side comparisons throwing more- and less-effective techniques into sharp relief. This book is an extension of that project, featuring a variety of makeovers that showcase various approaches to data communication and a focus on the analytical, design and storytelling skills that have been developed through #MakeoverMonday. Paging through the makeovers ignites immediate inspiration for your own work, provides insight into different perspectives, and highlights the techniques that truly make an impact. * Explore the many approaches to visual data communication * Think beyond the data and consider audience, stakeholders, and message * Design your graphs to be intuitive and more communicative * Assess the impact of layout, color, font, chart type, and other design choices Creating visual representation of complex datasets is tricky. There's the mandate to include all relevant data in a clean, readable format that best illustrates what the data is saying--but there is also the designer's impetus to showcase a command of the complexity and create multidimensional visualizations that "look cool." #MakeoverMonday shows you the many ways to walk the line between simple reporting and design artistry to create exactly the visualization the situation requires.
Informacje szczegółowe
| ID produktu: | 1195160216 |
|---|---|
| Tytuł: | #MakeoverMonday |
| Autor: | |
| Wydawnictwo: | |
| Język wydania: | english |
| Liczba stron: | 496 |
| GPSR - osoba odpowiedzialna i certyfikaty: |
Oceny i recenzje o produkcie
Nikt jeszcze nie dodał recenzji tego produktu.
Bądź pierwszy!Twoja opinia będzie bardzo przydatna dla innych użytkowników.